A detailed application of spaceMap
This webpage illustrates a detailed application of the spaceMap network analysis pipeline to real-world data from the Breast Cancer Proteogenomics Landscape Study (BCPLS). We show how to clean the data, fit spaceMap to learn networks, derive annotations, and ultimately layer biological meaning onto the model fit. Below, the flow chart provides an overview of each stage we will address in the pipeline: data, model fitting, network analysis, and visualization.
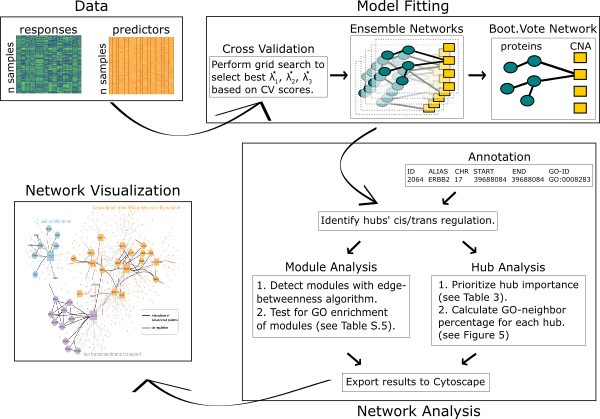
This specific application builds upon the original work of the BCPLS by performing an integrative analysis of copy number alterations (CNA) in breast tumors with corresponding protein expressions. The outcome of the integrative analysis is an annotated network revealing how CNA influence downstream protein-protein interactions of breast tumors. In addition to finding known amplifications and deletion signatures of CNA in breast cancer, the pipeline is able to link these CNA hubs to proteins enriched with cancer-related biological processes. All things considered, this pipeline exemplifies the power of reconstructing networks from data and leveraging bioinformatics toolkits to layer meaning onto the network. Full commentary on the biological context of the BCPLS application is reserved exclusively for the spaceMap publication, which is currently under review.
R environment
In addition to installing the spacemap package, reproduction of the BCPLS network analysis will require installation of the following R packages.
## try http:// if https:// URLs are not supported
source("https://bioconductor.org/biocLite.R")
BiocInstaller::biocLite()
biocLite(c("Biobase", "topGO", "GenomicRanges", "org.Hs.eg.db",
           "mygene"))
install.packages(c("ggplot2", "data.table", "fpc",
                   "stringdist"))
Copyright © 2017 Regents of the University of California. All rights reserved.