Description
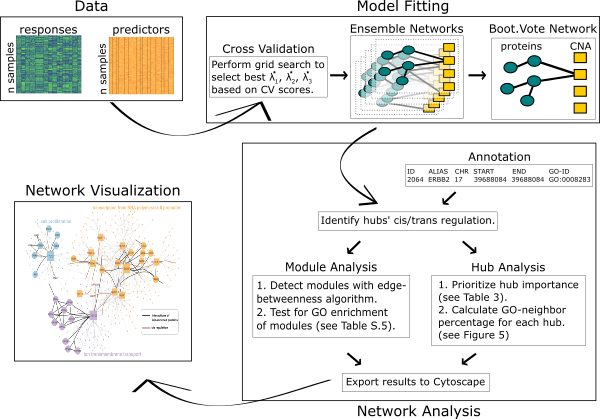
The spaceMap R package constructs de novo networks from multiple data types in a high-dimensional context by applying a novel conditional graphical model. spaceMap is motivated by applications in integrative genomics, where two (or more) -omic data profiles are modeled jointly to discover their interactions. spaceMap is particularly effective in learning networks that exhibit hub topology —a commonly encountered feature of many large networks. In addition to learning network structure, an accompanying network analysis toolkit is also provided. The toolkit has been developed with genomics applications in mind—but may be adapted for other applications —and maps scientic domain knowledge onto networks. The flowchart below provides an overview of the spaceMap analysis pipeline including model fitting, network analysis and visualization in an integrative genomic context.
The spaceMap analysis pipeline has been applied to The Breast Cancer Proteogomics Landscape Study data, where it learned regulatory networks which generated novel hypotheses of cancer drivers and confirmed known risk factors. Detailed analysis is hosted on the GitHub repository neta-bcpls.
Installation
The R package spacemap is available from GitHub. Please see the most recent beta release for installation.
Details
Model fitting
The spaceMap model fitting is illstruated by Model Fitting Basics under the Vignettes tab.
Learning robust networks
We built model selection and aggregation tools into spaceMap for learning robust networks. High throughput -omic experiments often have small sample sizes and the signal-to-noise ratio can be low. Models fitted from such data are often prone to over-fitting and high variability. By a procedure called CV.Vote, one can balance the trade-off between power and false discovery rate (FDR). CV.Vote reports a network where edges must be present in a majority of networks fitted under the training sets. Please see Model Tuning under the Vignettes tab for an example. Specific usage details of CV.Vote are documented in the function cvVote.
Over-fitting can be further mitigated through bootstrap aggregation—called Boot.Vote—especially when sample size relative to dimensionality is a real concern. This procedure learns an ensemble of networks built on bootstrap replicates of data under CV-selected tuning parameters. Only the edges with majority representation among these networks are reported in the final network. Please see Boostrap Ensemble Network under the Vignettes tab for an example. Specific usage details of Boot.Vote are documented in the functions bootEnsemble and bootVote.
Simulations
Several simulation experiments have been used to evaluate spaceMap in learning networks with prominent hub topology. The GitHub repository sim-spacemap contains codes of these simulations featuring:
- simulation of hub network topology
- data generation according to a given network topology
- fitting of spaceMap and other graphical models to the data
- evaluation of fitted networks relative to true network topology
Documentation of these simulation codes will be forthcoming.
Network analysis toolkit
Once a network has been learned, interpretation can be challenging. Thus, we included a network analysis toolkit as part of the spaceMap analysis pipeline to facilitate network interpretation with special focus on integrative genomic applications. With user supplied annotation of nodes (e.g. gene coordinates, functional description), this toolkit enables:
- identification of cis/trans regulatory relationship
- prioritization of hub nodes
- module analysis
- functional enrichment analysis (GO/KEGG)
All these features are reported through structured tables and are easily incorporated into technical reports. Moreover, the network analysis toolkit integrates the results into a network file (e.g. .graphml format) that can be exported to existing tools such as the Cytoscape ecosystem. This toolkit is illustrated by network analysis toolkit under the Vignettes tab.
